Most UK money statistics come from the same handful of places, get copied round the internet, and land on your screen two years out of date.
So we did two things. We ran our own survey of 1,679 UK adults between 10 April and 13 May 2026, and we went back to the primary releases from the ONS, HMRC, the Bank of England, the FCA, the DWP, UK Finance and the Insolvency Service rather than copying anyone else’s summary of them.
What follows is around 90 figures on how Britain earns, saves, invests, borrows and worries about money in 2026. Every one is sourced and dated. Our own numbers are marked as ours, and you can read the full survey breakdown here.
What are the key UK personal finance statistics for 2026?
- 70% of Brits would rather show someone their screen time report than their bank balance (Up The Gains, May 2026)
- 83% feel anxious about money at least sometimes, and 32% feel it often (Up The Gains, May 2026)
- 80% would sooner stick to a strict budget for a year than a strict diet (Up The Gains, May 2026)
- 46% of UK households have no savings at all or less than £1,500 (Family Resources Survey, 2024/25)
- The household saving ratio fell to 8.9% in the first quarter of 2026, from 10.5% a year earlier (ONS, June 2026)
- People in the UK owed £1,984.3 billion at the end of July 2026, or about £36,064 per adult (Bank of England and ONS, September 2026)
- Outstanding credit card debt reached £82.3 billion in July 2026, an average of £2,836 per household (Bank of England and ONS, September 2026)
- 1 in 371 adults in England and Wales entered insolvency in the year to June 2026 (Insolvency Service, July 2026)
- 33% of UK adults now invest, up from 31% a year earlier (Boring Money, 2026)
- A comfortable retirement costs a single person £45,400 a year before housing (PLSA Retirement Living Standards, 2026)
Who did we survey and how?
We surveyed 1,679 UK adults between 10 April and 13 May 2026, using fixed multiple-choice questions delivered online. Percentages are rounded to the nearest whole number, so some totals do not add to exactly 100.
Every figure on this page marked Our data comes from that survey and is free to quote with a link back. The full UK Money Confidence Report 2026 has the complete question-by-question breakdown.
How do UK adults feel about money?
Our data: 83% of UK adults feel anxious about money at least sometimes. 51% feel it sometimes, 32% feel it often, 15% rarely and just 2% never do (Up The Gains, May 2026)
Our data: 54% say they feel more confident about money than they did at the start of 2026. The other 46% feel less confident (Up The Gains, May 2026)
One in four UK adults has low financial resilience, meaning around 13 million people have missed payments, are struggling to keep up, or have no savings to fall back on (FCA Financial Lives, 2025)
49% of UK adults show at least one characteristic of vulnerability (FCA Financial Lives, 2025)
10.9 million adults are struggling to pay bills and credit commitments, up from 7.8 million in May 2022 (FCA Financial Lives, 2025)
61% of the 1.7 million people who used a debt advice service in the previous 12 months said their debts became more manageable as a result (FCA Financial Lives, 2025)
6.5 million UK adults, or 12%, had low financial capability in 2024, down from 7.4 million, or 14%, in 2022. 10.3 million adults, or 19%, lack confidence working with numbers and 9.8 million, or 18%, have poor financial numeracy (Financial Conduct Authority, May 2025)
Is money still a taboo subject in the UK?
Our data: 70% of Brits would rather hand over their screen time report than their bank balance. Only 30% would pick the bank balance (Up The Gains, May 2026)
Our data: 80% would sooner stick to a strict budget for a year than a strict diet (Up The Gains, May 2026)
Our data: Asked which is hardest, 39% said getting fit, 38% said saving money and 23% said keeping the house tidy (Up The Gains, May 2026)
How much do UK adults have in savings?
One in ten UK adults has no cash savings at all, 46% of households have less than £1,500 put away, and only 68% are confident of saving anything in the next three months.
Our data: 32% of UK adults are not confident they will save anything at all over the next three months. 26% are not very confident and 6% have zero confidence (Up The Gains, May 2026)
Our data: The other 68% are confident: 40% quite confident and 28% very confident (Up The Gains, May 2026)
46% of UK households have either no savings at all or less than £1,500. Among single parent households, 28% have no savings and 79% have less than £1,500 (Family Resources Survey, 2024/25)
The household saving ratio was 8.9% in the first quarter of 2026, down from 9.6% in the final quarter of 2025 and 10.5% a year earlier. It peaked at 27.4% during the pandemic and sat mostly between 7% and 10% from 2000 to 2015 (ONS, June 2026)
Pension saving rose over the same period, from 4.2% to 4.8% of income (ONS, June 2026)
One in ten UK adults has no cash savings at all, and a further 21% have less than £1,000 to fall back on (FCA Financial Lives, 2025)
The average instant access savings rate was 1.94% in July 2026, down from 2.24% a year earlier. The average variable rate cash ISA paid 2.06%, up from 1.74% (Bank of England, September 2026)
Households put £2.0 billion into ISAs in June 2026, plus £1.6 billion into interest-bearing time deposits, while withdrawing £1.3 billion from interest-bearing sight accounts (Bank of England, July 2026)
282,700 Help to Save accounts were open in April 2025, with an average deposit of £48 a month (HMRC, September 2025)
For the age-by-age picture, see our breakdown of average savings by age in the UK.
How many UK adults feel in control of their money?
Our data: Only 31% of UK adults feel fully in control of their weekly finances. A further 48% feel slightly in control (Up The Gains, May 2026)
Our data: 21% feel out of control of their week-to-week money: 18% slightly out of control and 3% very out of control (Up The Gains, May 2026)
What do UK households cut first when money is tight?
Our data: Asked what they would cut first if money got tight, 43% said eating out, 30% said entertainment, 19% said food and groceries and 9% said holidays (Up The Gains, May 2026)
CPI inflation rose to 2.9% in the 12 months to July 2026, up from 2.6% in June (ONS, August 2026)
CPIH, which includes owner occupiers’ housing costs, rose to 3.1% over the same period (ONS, August 2026)
The largest upward pressure came from housing and household services after the Ofgem energy price cap rose by 13% on 1 July 2026 (ONS, August 2026)
UK households spent around £165 million a day on water, sewerage, electricity, gas and other household fuels and services in the first quarter of 2026, about £5.70 per household per day and 6.1% more than a year earlier (Office for National Statistics, June 2026)
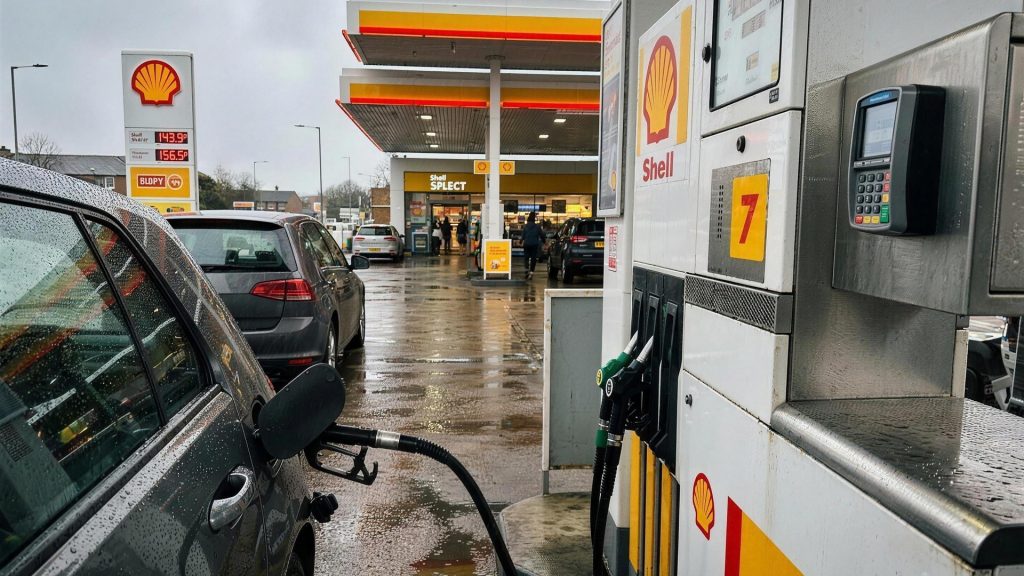
Unleaded petrol averaged 168.1p a litre on 14 September 2026, or £84.07 to fill a 50 litre tank. Diesel averaged 190.7p, or £95.36 a tank (Department for Energy Security and Net Zero, September 2026)
Raising a child to 18 costs a couple around £250,000, or £38.02 a day. For a lone parent it is £290,000, or £44.11 a day (Child Poverty Action Group, 2025)
The National Living Wage rose to £12.71 an hour on 1 April 2026 for those aged 21 and over. The 18 to 20 rate rose to £10.85 and the under-18 and apprentice rates to £8.00 (GOV.UK, April 2026)
How many UK adults invest?
33% of UK adults now invest, defined as holding a stocks and shares ISA, a personal pension or a general investment account. That is up from 31% a year earlier (Boring Money, 2026)
The UK advice gap widened to 14.6 million adults holding an estimated £1.05 trillion of assets, up from 12 million the year before (Boring Money, 2026)
9.9 million non-advised investors have low investment confidence, up from 8 million a year earlier, and 4.7 million people hold at least £10,000 in cash and say they are willing to invest but have not (Boring Money, 2026)
15 million adult ISAs were subscribed to in 2023 to 2024, the highest number since 2010 to 2011 (HMRC, September 2025)
£103 billion was paid into adult ISAs in 2023 to 2024 (HMRC, September 2025)
The total market value of ISA holdings reached £872 billion, a rise of 20.1% (HMRC, September 2025)
1.37 million Junior ISAs were subscribed to, holding £1.8 billion, at an average of £1,347 per account (HMRC, September 2025)
87,250 people used a Lifetime ISA to buy a first home in 2024 to 2025, withdrawing an average of £15,782 (HMRC, September 2025)
There were 5,070 ISA millionaires in the UK at the end of the 2022/23 tax year, up 5% from 4,850 a year earlier (HMRC data released under Freedom of Information to Plum).
The ISA allowance is £20,000 for the 2026/27 tax year. Two changes land on 6 April 2027, confirmed in a government factsheet published on 23 June 2026 and still subject to consultation.
First, the cash ISA allowance drops from £20,000 to £12,000 for under-65s. The overall £20,000 ISA limit is unchanged, so the remaining £8,000 has to go somewhere other than cash. The full £20,000 cash entitlement returns from the start of the tax year in which you turn 65.
Second, a 22% charge applies to interest earned on cash held inside a stocks and shares, Lifetime or innovative finance ISA. That is aimed at stopping people using an investment ISA as a way to hold cash once the cash limit is cut. Money market funds are exempt and are the only asset treated as cash-like. Shares, funds, investment trusts, ETFs and bonds including gilts are unaffected and stay tax-free.
If you are choosing where to hold it, we have tested and compared the main UK investing platforms and the best stocks and shares ISAs.
How much debt do UK households have?
People in the UK owed £1,984.3 billion at the end of July 2026, up 4.3% on a year earlier. Mortgages made up £1,726.8 billion of that and consumer credit £257.5 billion (Bank of England, September 2026)
Average total debt per household, including mortgages, was £68,424 at the end of July 2026. Per adult it was £36,064 (Bank of England and ONS, September 2026)
Of that £36,064 per adult, £31,383 is mortgage debt and £4,680 is unsecured consumer credit, of which £1,495 is on credit cards (Bank of England and ONS, September 2026)
Outstanding consumer credit stood at £254.8 billion at the end of May 2026, £16.6 billion more than a year earlier. Consumer credit grew 7.0% over the year and credit card borrowing grew 7.3% (Bank of England, July 2026)
Outstanding credit card debt reached £82.3 billion at the end of July 2026, an average of £2,836 per household (Bank of England and ONS, September 2026)
The quoted interest rate on credit card lending to households was 24.71% in July 2026. The effective rate actually paid on interest-bearing card balances was lower, at 21.45% (Bank of England, September 2026)
47.3% of credit card balances were bearing interest in April 2026 (UK Finance, Q1 2026)
Buy now pay later grew from £60 million in 2017 to over £13 billion in 2024. 10.9 million UK adults, or 20%, used it in the year to May 2024, up from 8.8 million, or 17%, in 2022. FCA regulation began on 15 July 2026 (Financial Conduct Authority, February 2026)
34,182 individuals entered insolvency in England and Wales between April and June 2026, up 11.0% on the same quarter in 2025. That is 376 people a day, or one every 3 minutes 50 seconds (Insolvency Service, July 2026)
On an average day in England and Wales, 23 people were made bankrupt, 132 debt relief orders were granted and 220 individual voluntary arrangements were entered into (Insolvency Service, July 2026)
1 in 371 adults in England and Wales, or 0.27% of the adult population, became insolvent in the 12 months to June 2026, a total of 135,550 people (Insolvency Service, July 2026)
2,957 consumer county court judgments were issued every day in England and Wales in the first quarter of 2026, up 18.3% on a year earlier, at a median value of £607 (Registry Trust, Q1 2026)
StepChange gave debt advice to 15,457 clients in June 2026, 14.9% more than in June 2025. 73% had credit card debt, 58% were female and 59% were under 40. Only 15% were homeowners (StepChange, June 2026)
Citizens Advice dealt with 1,276 debt issues every day in England and Wales in the year to April 2026. Average household bill debt per client rose from £2,194 in 2022 to £3,112 in 2025, and 50% of debt clients are now in a negative budget, up from 41% in 2021 (Citizens Advice, 2026)
How many UK workers are saving into a pension?
90% of eligible employees in Great Britain saved into a workplace pension in 2025, around 22.6 million people, up one percentage point on 2024 (DWP, July 2026)
Across all employees the participation rate was 82%, or 24.2 million people (DWP, July 2026)
Total annual workplace pension saving by eligible savers reached £166.1 billion in 2025, £63.5 billion more than in 2012 (DWP, July 2026)
Only around 55% of eligible private sector employees at micro employers, meaning businesses with fewer than five staff, are saving into a workplace pension (DWP, July 2026)
At least 11.45 million workers had been auto-enrolled by the end of May 2026, giving 24.32 million scheme members in total, but leaving over 12 million workers of a 36.4 million declared workforce unenrolled (The Pensions Regulator, May 2026)
55% of working age adults actively participated in a pension in 2024/25. That splits into 80% of employees and just 21% of the self-employed (Family Resources Survey, 2024/25)
33% of UK adults have less than £10,000 saved in pensions (FCA Financial Lives, 2025)
There were 13.2 million State Pension recipients in August 2025, 1.9% more than a year earlier. 5 million were on the new State Pension introduced in 2016 (Department for Work and Pensions, March 2026)
A minimum standard of living in retirement costs a single person £13,900 a year, a moderate one £32,700 and a comfortable one £45,400. These figures exclude rent and mortgage payments, so they assume the home is owned outright, and they are before tax (PLSA Retirement Living Standards, 2026)
For a couple the same three standards cost £22,500, £45,400 and £62,700 a year. In London every figure is higher, at £24,100, £47,000 and £64,800 (PLSA Retirement Living Standards, 2026)
The full new state pension is £241.30 a week in 2026/27, or £12,548 a year, after a 4.8% triple lock rise from £230.25. The basic state pension for those who reached state pension age before April 2016 rose to £184.90 a week from £176.45.
Set the comfortable standard of £45,400 against the state pension of £12,548 and the gap a private pension has to fill is about £32,850 a year. Our guide to the average UK pension pot shows how far short most people currently are.
What is the average UK household worth?
Median household wealth in Great Britain was £293,700 in the most recent Wealth and Assets Survey round, covering April 2020 to March 2022. Accreditation of the survey has been suspended from this round onwards because of falling response rates, so treat granular splits with caution (ONS Wealth and Assets Survey)
Property made up 40% of household wealth, private pensions 35%, financial wealth 14% and physical wealth 10% (ONS Wealth and Assets Survey)
Median pay for full-time employees was £39,039 a year, or £766.60 a week, in April 2025. That was a 5.3% rise in cash terms and 1.1% after inflation (ONS ASHE, October 2025)
Median full-time weekly earnings were £807.67 in the public sector against £752.28 in the private sector (ONS ASHE, October 2025)
Median full-time weekly pay was £373.20 for 16 to 17 year olds, £498.50 for 18 to 21 year olds and £648.20 for 22 to 29 year olds (ONS ASHE, October 2025)
The average UK house price rose 2.0% in the year to June 2026 to £272,000, down from a revised 3.0% in the year to May (ONS and HM Land Registry, August 2026)
Average UK private rent was £1,388 a month in June 2026, up 3.3% on the year. In London it was £2,302. A one-bed flat averaged £1,127 across the UK and £1,740 in London (ONS and VOA, July 2026)
Rents rose fastest in the North East at 6.3%, the North West at 5.4% and Wales at 4.9%. London at 2.2% and Scotland at 1.3% saw the smallest rises (ONS and VOA, July 2026)
Outstanding mortgage lending stood at £1,726.8 billion at the end of July 2026, up 3.6% on a year earlier (Bank of England, September 2026)
The effective interest rate on newly drawn mortgages rose to 4.22% in May 2026, up from 4.08% in April. The average rate across all outstanding mortgages was 3.92% (Bank of England, July 2026)
79,110 homeowner mortgages, or 0.91%, were in arrears of at least 2.5% of the balance in the first quarter of 2026, down 1.7% on the previous quarter (UK Finance, Q1 2026)
1,250 homeowner properties were repossessed in the UK between January and March 2026, or 13.9 a day, one every 1 hour and 44 minutes (UK Finance, Q1 2026)
44% of UK homes listed for sale over the past three years failed to find a buyer. Homes that did sell in the first quarter of 2026 went for 3.5% below the original asking price, around £18,000 (Zoopla, May 2026)
64.8% of households were owner occupiers in 2024/25, while 18.9% rented privately and 16.3% paid a social rent (Family Resources Survey, 2024/25)
We break the wealth numbers down further in our guides to average net worth by age, the top 1% net worth in the UK and how many millionaires there are in the UK.
Can I use these figures in my own content?
Every figure marked Our data is original research by Up The Gains and is free to use in your own reporting or content, with a link back to this page.
Suggested citation:
Up The Gains, UK Personal Finance Statistics 2026, survey of 1,679 UK adults conducted 10 April to 13 May 2026. https://upthegains.co.uk/blog/uk-personal-finance-statistics
For interview requests, the full data tables or a specific cross-break, contact us through the contact page.
Where do these figures come from?
Our own figures come from an online survey of 1,679 UK adults run between 10 April and 13 May 2026 using fixed multiple-choice questions. Percentages are rounded to the nearest whole number.
Third-party figures were taken from the primary release in each case and checked against it on 19 August 2026, rather than lifted from other summaries. The debt, savings rate, cost of living, pension and housing figures were rechecked against the newest releases on 16 September 2026. Per-adult and per-household averages are our own calculation: Bank of England amounts outstanding divided by the ONS mid-2024 UK population aged 18 and over (55.0 million) and the ONS count of UK households in 2025 (29.0 million). Where official data runs behind, the reference period is stated next to the figure rather than the publication date, because the two are often more than a year apart. This page is reviewed each January and each May.
Sources used:
- Up The Gains, UK Money Confidence Report 2026 (survey of 1,679 UK adults, May 2026)
- ONS, Quarterly economic commentary: January to March 2026 (June 2026)
- ONS, Consumer price inflation, UK: July 2026 (August 2026)
- ONS and HM Land Registry, Private rent and house prices, UK: August 2026
- ONS, Consumer trends, UK: January to March 2026 (June 2026)
- ONS, Household total wealth in Great Britain, April 2020 to March 2022
- ONS, Annual Survey of Hours and Earnings 2025 (published 23 October 2025, April 2025 data)
- HMRC, Annual savings statistics (September 2025), covering 2023 to 2024
- HMRC, ISA millionaire data released under Freedom of Information
- FCA, Financial Lives survey (published 2025)
- Bank of England, Money and Credit, July 2026 (published 1 September 2026), and Bankstats quoted household interest rates
- Insolvency Service, Individual insolvency statistics (July 2026)
- UK Finance, arrears and possessions and card spending data (Q1 and Q2 2026)
- Registry Trust, county court judgment data (Q1 2026)
- StepChange, client statistics (June 2026)
- Citizens Advice, advice trends and client research (2026)
- DWP, Workplace pension participation and savings trends 2009 to 2025 (published 30 July 2026)
- DWP, Family Resources Survey 2024/25
- The Pensions Regulator, Automatic enrolment compliance report (May 2026)
- PLSA, Retirement Living Standards (research conducted 2025, modelling completed 2026)
- Child Poverty Action Group, The Cost of a Child in 2025
- Boring Money, retail investing and advice gap research (2026)
- Department for Energy Security and Net Zero, Weekly road fuel prices (September 2026)
- GOV.UK, National Minimum Wage and National Living Wage rates (April 2026)
- DWP, DWP benefit statistics: February 2026 (March 2026)
- Zoopla, Why half of UK homes fail to sell (May 2026)
- ONS, Population estimates for the UK, mid-2024 (published 26 September 2025)
- ONS, Families and Households, UK: 2025 (published 17 April 2026)
- FCA, New protections confirmed for Buy Now Pay Later borrowers (February 2026)
Spotted a figure that has moved or a source we have missed? Tell us through the corrections page and we will update it.