
Sammie Ellard-King
I’m Sammie, a money expert and business owner passionate about helping you take control of your wallet. My mission with Up the Gains is to create a safe space to help improve your finances, cut your costs and make you feel good while doing it.
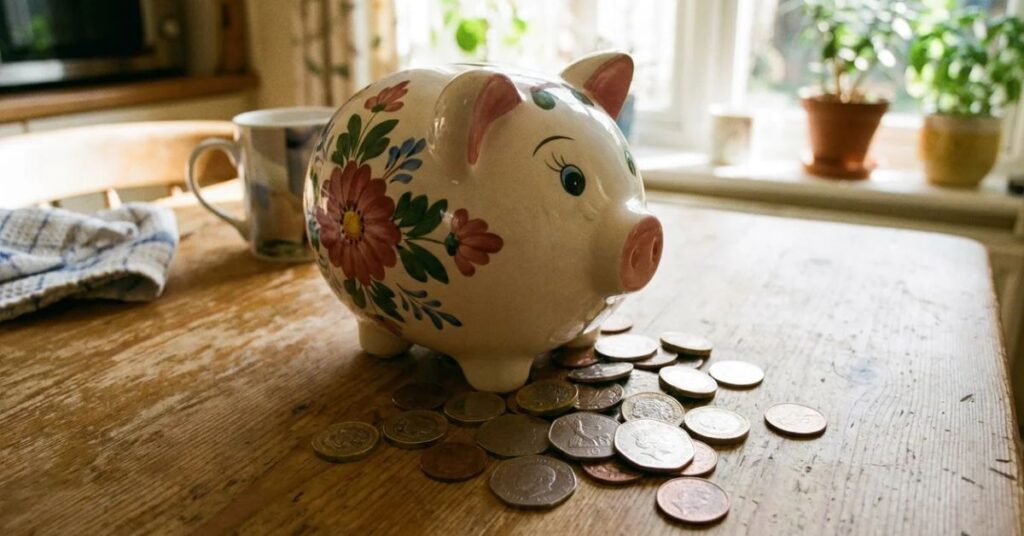
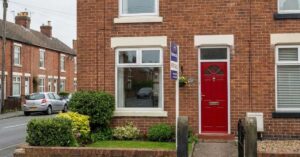
Council tax is one of those bills that just appears every year.
You pay it, you don’t really think about it, and then it goes up again.
But new data shows that depending on where you live, council tax could be swallowing a wildly different slice of your income – and the gap is bigger than most people realise.
In some northern towns, residents are spending close to 11% of their annual income just on council tax.
In parts of London, that figure drops as low as 2%.
Same country. Very different reality.
So How Does This Actually Work?
Council tax isn’t just about the rate your local authority sets.
It’s about how that figure stacks up against what people in your area actually earn.
A borough in Lancashire might charge a similar-sounding council tax rate to a borough in London.
But if average incomes in Lancashire are half what they are in London, the financial hit on residents is twice as heavy.
That’s the key thing the data from removals company Getamover.co.uk highlighted when they compared Band D council tax costs for 2025/26 against median household incomes across English local authorities.
The north-south divide it uncovered was stark.
More news:


Where Are People Paying the Most Relative to Their Income?
Pendle in Lancashire tops the list. Residents there pay around £2,535 a year in Band D council tax — against a median annual income of just £23,100. That works out at nearly 11% of take-home pay going straight to the council.
To put that in perspective, Pendle also has the highest level of child poverty of any UK local authority, with over 43% of children in low-income families.
The rest of the top 10 is similarly concentrated in Northern and Midlands areas:
| Area | Band D Council Tax | Median Income | % of Income |
|---|---|---|---|
| Pendle | £2,535 | £23,100 | 10.97% |
| City of Nottingham | £2,656 | £24,300 | 10.93% |
| Burnley | £2,456 | £23,600 | 10.41% |
| Blackpool | £2,392 | £23,300 | 10.27% |
| Torridge | £2,479 | £24,200 | 10.24% |
| Redcar and Cleveland | £2,424 | £23,800 | 10.19% |
| Middlesbrough | £2,488 | £24,500 | 10.15% |
| Ashfield | £2,507 | £24,700 | 10.15% |
| Walsall | £2,498 | £24,700 | 10.11% |
| North Devon | £2,515 | £24,900 | 10.10% |
Every single area in that top 10 is outside London and the South East.
And Where Are People Paying the Least?
The City of London sits at the other end of the scale. Residents there pay around £1,274 a year in council tax — but on median incomes of £60,700, that’s just 2.1% of earnings.
Nine of the 10 areas with the lowest burden relative to income are London boroughs.
| Area | Band D Council Tax | Median Income | % of Income |
|---|---|---|---|
| City of London | £1,274 | £60,700 | 2.10% |
| Wandsworth | £998 | £42,200 | 2.36% |
| Westminster | £1,019 | £42,600 | 2.39% |
| Kensington and Chelsea | £1,592 | £47,700 | 3.34% |
| Hammersmith and Fulham | £1,451 | £38,300 | 3.79% |
The City of London has some of the most expensive property in the country — 13% of homes there are worth more than £2 million. Yet residents pay less than a quarter of the proportion of income that someone in Pendle pays.
This Isn't Just a Quirky Stat — It Has Real Consequences
Research from The Equality Trust found the poorest 10% of households pay around 7% of their income on council tax. The richest 10% pay just 1.2%.
The Northern Powerhouse Partnership has also found the council tax burden is around 30% heavier in the North than in the South, when you account for the salary gap between regions.
This isn’t because northern councils are reckless spenders. Part of the reason is that council tax bands are still based on property valuations from 1991 — over 30 years ago. Property prices haven’t risen evenly across the country since then, which means the system is increasingly out of step with where wealth actually sits.
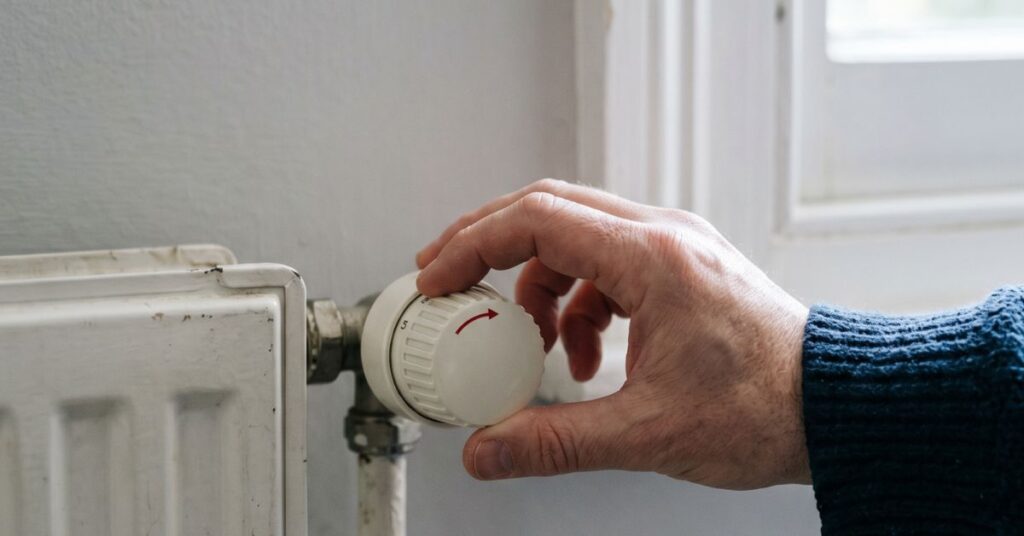
What's Happening to Council Tax Bills Right Now?
Bills are going up again this April. For 2026/27, most councils in England are raising council tax by close to the maximum 4.99% allowed without triggering a local referendum.
The average Band D bill for 2025/26 was £2,280 — a 5% rise on the year before. A further 4.99% increase this year adds roughly another £114 to that, pushing the average towards £2,394.
Seven councils have been given special permission to raise bills even higher this year:
- North Somerset, Shropshire and Worcestershire — up to 9%
- Trafford, Warrington and Windsor & Maidenhead — up to 7.5%
- Bournemouth, Christchurch & Poole — up to 6.74%
Five London boroughs — Kensington and Chelsea, Westminster, Wandsworth, City of London and Hammersmith and Fulham — have also been allowed to raise bills above the standard cap to help balance funding cuts.
In Wales, councils are proposing rises of between 3% and 5.2%. In Scotland, some areas are looking at increases of up to 7.5%. Northern Ireland faces average rises of 5% to 7% in district rates.
If you found this interesting, please share!
Disclaimer: Content on this page is for informational purposes and does not constitute financial advice. Always do your own research before making a financially related decision.